Exercise 2.9#
%matplotlib inline
import pandas as pd
import seaborn as sns
import matplotlib.pyplot as plt

pd.options.display.float_format = '{:,.2f}'.format # Print only 2 decimal cases.
df = pd.read_csv('../data/auto.csv')
df
| mpg | cylinders | displacement | horsepower | weight | acceleration | year | origin | name | |
|---|---|---|---|---|---|---|---|---|---|
| 0 | 18.00 | 8 | 307.00 | 130 | 3504 | 12.00 | 70 | 1 | chevrolet chevelle malibu |
| 1 | 15.00 | 8 | 350.00 | 165 | 3693 | 11.50 | 70 | 1 | buick skylark 320 |
| 2 | 18.00 | 8 | 318.00 | 150 | 3436 | 11.00 | 70 | 1 | plymouth satellite |
| 3 | 16.00 | 8 | 304.00 | 150 | 3433 | 12.00 | 70 | 1 | amc rebel sst |
| 4 | 17.00 | 8 | 302.00 | 140 | 3449 | 10.50 | 70 | 1 | ford torino |
| 5 | 15.00 | 8 | 429.00 | 198 | 4341 | 10.00 | 70 | 1 | ford galaxie 500 |
| 6 | 14.00 | 8 | 454.00 | 220 | 4354 | 9.00 | 70 | 1 | chevrolet impala |
| 7 | 14.00 | 8 | 440.00 | 215 | 4312 | 8.50 | 70 | 1 | plymouth fury iii |
| 8 | 14.00 | 8 | 455.00 | 225 | 4425 | 10.00 | 70 | 1 | pontiac catalina |
| 9 | 15.00 | 8 | 390.00 | 190 | 3850 | 8.50 | 70 | 1 | amc ambassador dpl |
| 10 | 15.00 | 8 | 383.00 | 170 | 3563 | 10.00 | 70 | 1 | dodge challenger se |
| 11 | 14.00 | 8 | 340.00 | 160 | 3609 | 8.00 | 70 | 1 | plymouth 'cuda 340 |
| 12 | 15.00 | 8 | 400.00 | 150 | 3761 | 9.50 | 70 | 1 | chevrolet monte carlo |
| 13 | 14.00 | 8 | 455.00 | 225 | 3086 | 10.00 | 70 | 1 | buick estate wagon (sw) |
| 14 | 24.00 | 4 | 113.00 | 95 | 2372 | 15.00 | 70 | 3 | toyota corona mark ii |
| 15 | 22.00 | 6 | 198.00 | 95 | 2833 | 15.50 | 70 | 1 | plymouth duster |
| 16 | 18.00 | 6 | 199.00 | 97 | 2774 | 15.50 | 70 | 1 | amc hornet |
| 17 | 21.00 | 6 | 200.00 | 85 | 2587 | 16.00 | 70 | 1 | ford maverick |
| 18 | 27.00 | 4 | 97.00 | 88 | 2130 | 14.50 | 70 | 3 | datsun pl510 |
| 19 | 26.00 | 4 | 97.00 | 46 | 1835 | 20.50 | 70 | 2 | volkswagen 1131 deluxe sedan |
| 20 | 25.00 | 4 | 110.00 | 87 | 2672 | 17.50 | 70 | 2 | peugeot 504 |
| 21 | 24.00 | 4 | 107.00 | 90 | 2430 | 14.50 | 70 | 2 | audi 100 ls |
| 22 | 25.00 | 4 | 104.00 | 95 | 2375 | 17.50 | 70 | 2 | saab 99e |
| 23 | 26.00 | 4 | 121.00 | 113 | 2234 | 12.50 | 70 | 2 | bmw 2002 |
| 24 | 21.00 | 6 | 199.00 | 90 | 2648 | 15.00 | 70 | 1 | amc gremlin |
| 25 | 10.00 | 8 | 360.00 | 215 | 4615 | 14.00 | 70 | 1 | ford f250 |
| 26 | 10.00 | 8 | 307.00 | 200 | 4376 | 15.00 | 70 | 1 | chevy c20 |
| 27 | 11.00 | 8 | 318.00 | 210 | 4382 | 13.50 | 70 | 1 | dodge d200 |
| 28 | 9.00 | 8 | 304.00 | 193 | 4732 | 18.50 | 70 | 1 | hi 1200d |
| 29 | 27.00 | 4 | 97.00 | 88 | 2130 | 14.50 | 71 | 3 | datsun pl510 |
| ... | ... | ... | ... | ... | ... | ... | ... | ... | ... |
| 367 | 28.00 | 4 | 112.00 | 88 | 2605 | 19.60 | 82 | 1 | chevrolet cavalier |
| 368 | 27.00 | 4 | 112.00 | 88 | 2640 | 18.60 | 82 | 1 | chevrolet cavalier wagon |
| 369 | 34.00 | 4 | 112.00 | 88 | 2395 | 18.00 | 82 | 1 | chevrolet cavalier 2-door |
| 370 | 31.00 | 4 | 112.00 | 85 | 2575 | 16.20 | 82 | 1 | pontiac j2000 se hatchback |
| 371 | 29.00 | 4 | 135.00 | 84 | 2525 | 16.00 | 82 | 1 | dodge aries se |
| 372 | 27.00 | 4 | 151.00 | 90 | 2735 | 18.00 | 82 | 1 | pontiac phoenix |
| 373 | 24.00 | 4 | 140.00 | 92 | 2865 | 16.40 | 82 | 1 | ford fairmont futura |
| 374 | 36.00 | 4 | 105.00 | 74 | 1980 | 15.30 | 82 | 2 | volkswagen rabbit l |
| 375 | 37.00 | 4 | 91.00 | 68 | 2025 | 18.20 | 82 | 3 | mazda glc custom l |
| 376 | 31.00 | 4 | 91.00 | 68 | 1970 | 17.60 | 82 | 3 | mazda glc custom |
| 377 | 38.00 | 4 | 105.00 | 63 | 2125 | 14.70 | 82 | 1 | plymouth horizon miser |
| 378 | 36.00 | 4 | 98.00 | 70 | 2125 | 17.30 | 82 | 1 | mercury lynx l |
| 379 | 36.00 | 4 | 120.00 | 88 | 2160 | 14.50 | 82 | 3 | nissan stanza xe |
| 380 | 36.00 | 4 | 107.00 | 75 | 2205 | 14.50 | 82 | 3 | honda accord |
| 381 | 34.00 | 4 | 108.00 | 70 | 2245 | 16.90 | 82 | 3 | toyota corolla |
| 382 | 38.00 | 4 | 91.00 | 67 | 1965 | 15.00 | 82 | 3 | honda civic |
| 383 | 32.00 | 4 | 91.00 | 67 | 1965 | 15.70 | 82 | 3 | honda civic (auto) |
| 384 | 38.00 | 4 | 91.00 | 67 | 1995 | 16.20 | 82 | 3 | datsun 310 gx |
| 385 | 25.00 | 6 | 181.00 | 110 | 2945 | 16.40 | 82 | 1 | buick century limited |
| 386 | 38.00 | 6 | 262.00 | 85 | 3015 | 17.00 | 82 | 1 | oldsmobile cutlass ciera (diesel) |
| 387 | 26.00 | 4 | 156.00 | 92 | 2585 | 14.50 | 82 | 1 | chrysler lebaron medallion |
| 388 | 22.00 | 6 | 232.00 | 112 | 2835 | 14.70 | 82 | 1 | ford granada l |
| 389 | 32.00 | 4 | 144.00 | 96 | 2665 | 13.90 | 82 | 3 | toyota celica gt |
| 390 | 36.00 | 4 | 135.00 | 84 | 2370 | 13.00 | 82 | 1 | dodge charger 2.2 |
| 391 | 27.00 | 4 | 151.00 | 90 | 2950 | 17.30 | 82 | 1 | chevrolet camaro |
| 392 | 27.00 | 4 | 140.00 | 86 | 2790 | 15.60 | 82 | 1 | ford mustang gl |
| 393 | 44.00 | 4 | 97.00 | 52 | 2130 | 24.60 | 82 | 2 | vw pickup |
| 394 | 32.00 | 4 | 135.00 | 84 | 2295 | 11.60 | 82 | 1 | dodge rampage |
| 395 | 28.00 | 4 | 120.00 | 79 | 2625 | 18.60 | 82 | 1 | ford ranger |
| 396 | 31.00 | 4 | 119.00 | 82 | 2720 | 19.40 | 82 | 1 | chevy s-10 |
397 rows × 9 columns
Looks good so far, no missing values in sight.
df.info()
<class 'pandas.core.frame.DataFrame'>
RangeIndex: 397 entries, 0 to 396
Data columns (total 9 columns):
mpg             397 non-null float64
cylinders       397 non-null int64
displacement    397 non-null float64
horsepower      397 non-null object
weight          397 non-null int64
acceleration    397 non-null float64
year            397 non-null int64
origin          397 non-null int64
name            397 non-null object
dtypes: float64(3), int64(4), object(2)
memory usage: 28.0+ KB
It seems suspicious that ‘horsepower’ is of ‘object’ type. Let’s have a closer look.
df.horsepower.unique()
array(['130', '165', '150', '140', '198', '220', '215', '225', '190',
       '170', '160', '95', '97', '85', '88', '46', '87', '90', '113',
       '200', '210', '193', '?', '100', '105', '175', '153', '180', '110',
       '72', '86', '70', '76', '65', '69', '60', '80', '54', '208', '155',
       '112', '92', '145', '137', '158', '167', '94', '107', '230', '49',
       '75', '91', '122', '67', '83', '78', '52', '61', '93', '148', '129',
       '96', '71', '98', '115', '53', '81', '79', '120', '152', '102',
       '108', '68', '58', '149', '89', '63', '48', '66', '139', '103',
       '125', '133', '138', '135', '142', '77', '62', '132', '84', '64',
       '74', '116', '82'], dtype=object)
Ok, so there are some missing values represented by a question mark.
df = df[df.horsepower != '?'].copy() # [1]
df['horsepower']=pd.to_numeric(df['horsepower'])
df.info()
<class 'pandas.core.frame.DataFrame'>
Int64Index: 392 entries, 0 to 396
Data columns (total 9 columns):
mpg             392 non-null float64
cylinders       392 non-null int64
displacement    392 non-null float64
horsepower      392 non-null int64
weight          392 non-null int64
acceleration    392 non-null float64
year            392 non-null int64
origin          392 non-null int64
name            392 non-null object
dtypes: float64(3), int64(5), object(1)
memory usage: 30.6+ KB
a) Quantitative and qualitative predictors#
df.head()
| mpg | cylinders | displacement | horsepower | weight | acceleration | year | origin | name | |
|---|---|---|---|---|---|---|---|---|---|
| 0 | 18.00 | 8 | 307.00 | 130 | 3504 | 12.00 | 70 | 1 | chevrolet chevelle malibu |
| 1 | 15.00 | 8 | 350.00 | 165 | 3693 | 11.50 | 70 | 1 | buick skylark 320 |
| 2 | 18.00 | 8 | 318.00 | 150 | 3436 | 11.00 | 70 | 1 | plymouth satellite |
| 3 | 16.00 | 8 | 304.00 | 150 | 3433 | 12.00 | 70 | 1 | amc rebel sst |
| 4 | 17.00 | 8 | 302.00 | 140 | 3449 | 10.50 | 70 | 1 | ford torino |
Quantitative predictors:
quantitative = df.select_dtypes(include=['number']).columns
quantitative
Index(['mpg', 'cylinders', 'displacement', 'horsepower', 'weight',
       'acceleration', 'year', 'origin'],
      dtype='object')
Qualitative predictors:
qualitative = df.select_dtypes(exclude=['number']).columns
qualitative
Index(['name'], dtype='object')
b) Range of each quantitative predictor#
a = df.describe()
a.loc['range'] = a.loc['max'] - a.loc['min']
a.loc['range']
mpg               37.60
cylinders          5.00
displacement     387.00
horsepower       184.00
weight         3,527.00
acceleration      16.80
year              12.00
origin             2.00
Name: range, dtype: float64
c) Mean and standard deviation#
a.loc[['mean','std', 'range']]
| mpg | cylinders | displacement | horsepower | weight | acceleration | year | origin | |
|---|---|---|---|---|---|---|---|---|
| mean | 23.45 | 5.47 | 194.41 | 104.47 | 2,977.58 | 15.54 | 75.98 | 1.58 |
| std | 7.81 | 1.71 | 104.64 | 38.49 | 849.40 | 2.76 | 3.68 | 0.81 |
| range | 37.60 | 5.00 | 387.00 | 184.00 | 3,527.00 | 16.80 | 12.00 | 2.00 |
d) Mean and standard deviation, removing observations#
df_b = df.drop(df.index[10:85])
b = df_b.describe()
b.loc['range'] = b.loc['max'] - b.loc['min']
b.loc[['mean','std', 'range']]
| mpg | cylinders | displacement | horsepower | weight | acceleration | year | origin | |
|---|---|---|---|---|---|---|---|---|
| mean | 24.37 | 5.38 | 187.88 | 101.00 | 2,938.85 | 15.70 | 77.12 | 1.60 |
| std | 7.87 | 1.66 | 100.17 | 36.00 | 811.64 | 2.72 | 3.13 | 0.82 |
| range | 35.60 | 5.00 | 387.00 | 184.00 | 3,348.00 | 16.30 | 12.00 | 2.00 |
e) Visualizing relationships between variables#
We use some common visualization tools, namely:
Scatterplots
Box plots
Histograms
g = sns.PairGrid(df, size=2)
g.map_upper(plt.scatter, s=3)
g.map_diag(plt.hist)
g.map_lower(sns.kdeplot, cmap="Blues_d")
g.fig.set_size_inches(12, 12)
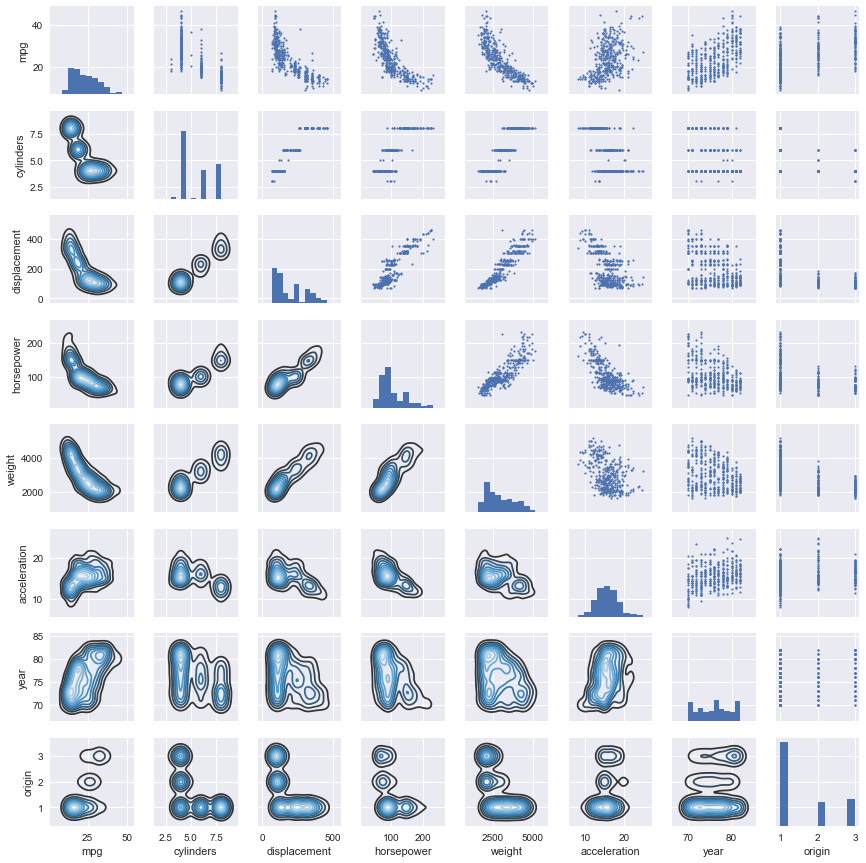
The histogram for ‘acceleration’ resembles a normal distribution.
‘displacement’ and ‘weight’ have a strong linear relationship.
‘mpg’ has a non-linear relationship with ‘weight’, ‘horsepower’ and ‘displacement’.
f) Predicting mpg#
Based on the previous question, we could use weight, horsepower and displacement. As seen in the scatterplots, these variables seem to have a non-linear relationship with mpg. Are these relationships statistically significant? Exercises 3.8 and 3.9 delve further into this matter.