Exercise 9.2#
import pandas as pd
import matplotlib.pyplot as plt

%matplotlib inline
(a)#
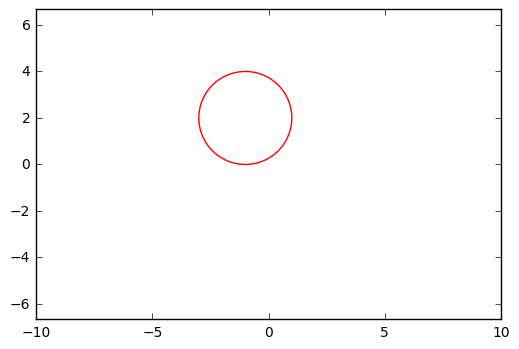
\((1+X_1)^2+(2-X_2)^2=4\) is the equation of a circle. The circle equation is in the format \((x – h)^2 + (y – k)^2 = r^2\), where h and k are the center of the circle and r is the radius.
# Draw circle
circle =plt.Circle((-1,2), 2, color='r', fill=False)

fig, ax = plt.subplots()

ax.axis("equal")  # To avoid oval circles. Check the References.
ax.add_artist(circle)
ax.set_xlim((-10,10))
ax.set_ylim((-10,10))
(-10, 10)

(b)#
# Draw circle
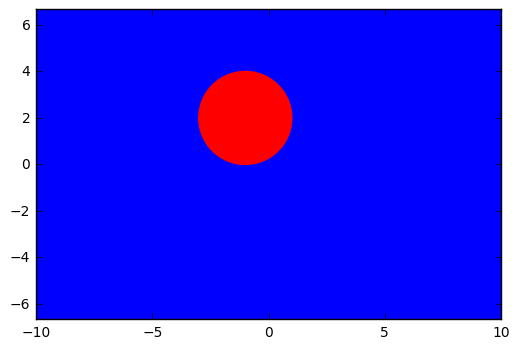
circle_background =plt.Circle((-1,2), 20, color='b')  # Way to fool matplotlib and have a colored background.
circle =plt.Circle((-1,2), 2, color='r')

fig, ax = plt.subplots()

ax.axis("equal")  # To avoid oval circles. Check the References.
ax.add_artist(circle_background)
ax.add_artist(circle)
ax.set_xlim((-10,10))
ax.set_ylim((-10,10))
plt.show()

\((1+X_1)^2+(2-X_2)^2>4\) - Blue region.
\((1+X_1)^2+(2-X_2)^2 \leq 4\) - Red region.
(c)#
# Draw circle
circle_background =plt.Circle((-1,2), 20, color='b')  # Way to fool matplotlib and have a colored background.
circle =plt.Circle((-1,2), 2, color='r')

fig, ax = plt.subplots()
fig.set_size_inches(10, 9)

ax.axis("equal")  # To avoid oval circles. Check the References.
ax.add_artist(circle_background)
ax.add_artist(circle)
ax.set_xlim((-10,10))
ax.set_ylim((-1,10))

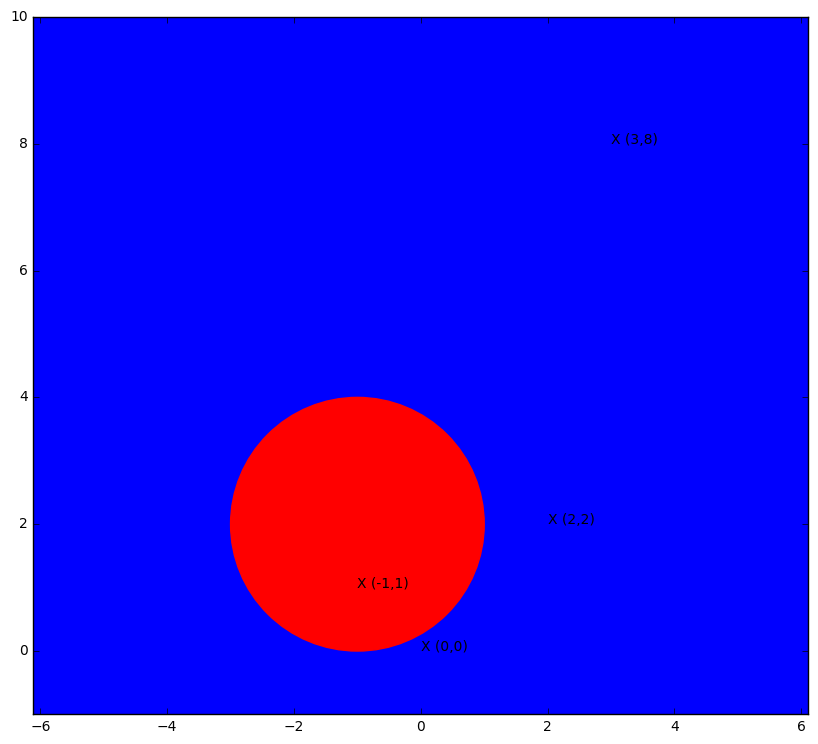
plt.annotate('X (0,0)', xy=(0,0), xytext=(0,0))
plt.annotate('X (-1,1)', xy=(-1,1), xytext=(-1,1))
plt.annotate('X (2,2)', xy=(2,2), xytext=(2,2))
plt.annotate('X (3,8)', xy=(3,8), xytext=(3,8))
plt.show()

Blue region - (0,0); (2,2); (3,8).
Red region - (-1,1).
References#
http://stackoverflow.com/questions/9215658/plot-a-circle-with-pyplot (how to draw a circle)
http://stackoverflow.com/questions/9230389/why-is-matplotlib-plotting-my-circles-as-ovals/9232513#9232513 (solving matplot oval circles)
