Exercise 4.12#
import matplotlib.pyplot as plt
import numpy as np

%matplotlib inline
(a)#
def Power():
    print(2**3)
Power()
8
(b)#
def Power2(x,a):
    print(x**a)
Power2(3,8)
6561
(c)#
Power2(10,3)
1000
Power2(8,17)
2251799813685248
Power2(131,3)
2248091
(d)#
def Power3(x,a):
    result = x**a
    return result
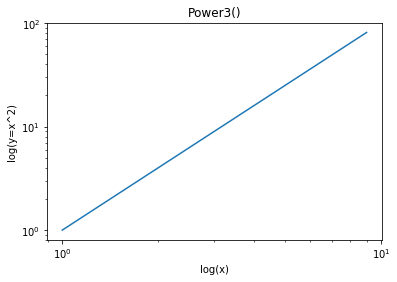
(e)#
def Plot(log=''):
    x = np.arange(1,10)
    y = Power3(x,2)

    #create plot
    fig, ax = plt.subplots()

    #config plot
    ax.set_xlabel('x')
    ax.set_ylabel('y=x^2')
    ax.set_title('Power3()')

    #change scale according to axis
    if log == 'x':
        ax.set_xscale('log')
        ax.set_xlabel('log(x)')
    if log == 'y':
        ax.set_yscale('log')
        ax.set_ylabel('log(y=x^2)')
    if log == 'xy':
        ax.set_xscale('log')
        ax.set_yscale('log')
        ax.set_xlabel('log(x)')
        ax.set_ylabel('log(y=x^2)')

    #draw plot
    ax.plot(x, y)
Plot(log='xy')
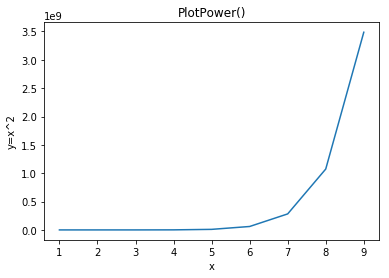
(f)#
def PlotPower(start,end,power,log=''):
    x = np.arange(start,end)
    y = np.power(x,end)

    #create plot
    fig, ax = plt.subplots()

    #config plot
    ax.set_xlabel('x')
    ax.set_ylabel('y=x^2')
    ax.set_title('PlotPower()')

    #change scale according to axis
    if log == 'x':
        ax.set_xscale('log')
        ax.set_xlabel('log(x)')
    if log == 'y':
        ax.set_yscale('log')
        ax.set_ylabel('log(y=x^2)')
    if log == 'xy':
        ax.set_xscale('log')
        ax.set_yscale('log')
        ax.set_xlabel('log(x)')
        ax.set_ylabel('log(y=x^2)')

    #draw plot
    ax.plot(x, y)
PlotPower(1,10,3)