Exercise 7.4#
import numpy as np
import matplotlib.pyplot as plt

%matplotlib inline
To solve this exercise, we just have to replace X in the expression. The main expression is:
\[Y =\beta_0 + \beta_1 b_1(X) + \beta_2 b_2(X) + \epsilon \]
where \(\hat{\beta}_0 = 1\), \(\hat{\beta}_1 = 1\) and \(\hat{\beta}_2 = 3\). Accordingly, we get the expression:
\[Y = 1 + b_1(X) + 3 \times b_2(X) + \epsilon \]
Considering that \(I(a \leq X \leq b) = 1\) as long as X is in the interval [a,b] (being zero otherwise), and since we are just estimating the curve between the interval [-2,2], our expression turns into:
\[Y = 1 + b_1(X) + \epsilon \]
At this point, we can make the necessary computations to solve the exercise:
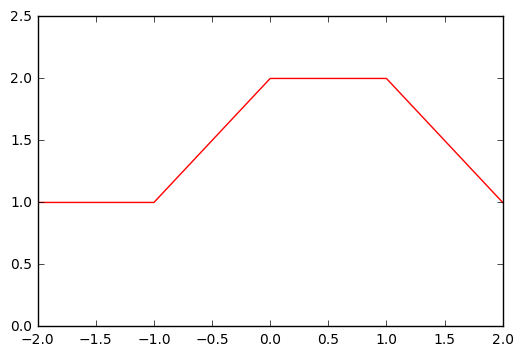
\(X=-2 \implies Y = 1\)
\(X=-1 \implies Y = 1\)
\(X=0 \implies Y = 2\)
\(X=1 \implies Y = 2\)
\(X=2 \implies Y = 1\)
# Plot
x = np.arange(-2,3,1)
y = [1,1,2,2,1]


plt.xlim([-2,2])
plt.ylim([0,2.5])
plt.plot(x,y,'-r');
[<matplotlib.lines.Line2D at 0x81007f0>]