Exercise 8.4#
import pandas as pd
import matplotlib.pyplot as plt

%matplotlib inline
(a)#
—————-X1<=1—————-
—————– | —————–
——–X2<=1—————Y=5——
——— | ————————-
—X1<=0——Y=15——————-
— | ——————————-
Y=3—X2<=0————————–
——- | —————————
—-Y=10–Y=0————————
We didn’t find the beautiful way of doing this, but we believe you’ll find and share with us :)
(b)#
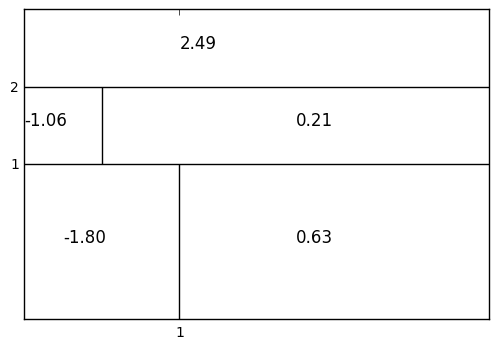
# Plot according to the tree presented in the figure
plt.plot()
plt.xlim(-1,5)
plt.ylim(-1,3)
plt.xticks([1])
plt.yticks([1,2])
plt.vlines(1, ymin=-5, ymax=1)
plt.vlines(0, ymin=1, ymax=2)
plt.hlines(1, xmin=-5, xmax=5)
plt.hlines(2, xmin=-5, xmax=5)
plt.annotate('-1.80', xy=(-.5,0), fontsize=12)
plt.annotate('-1.06', xy=(-1,1.5), fontsize=12)
plt.annotate('0.63', xy=(2.5,0), fontsize=12)
plt.annotate('0.21', xy=(2.5,1.5), fontsize=12)
plt.annotate('2.49', xy=(1,2.5), fontsize=12)
<matplotlib.text.Annotation at 0xc486e10>